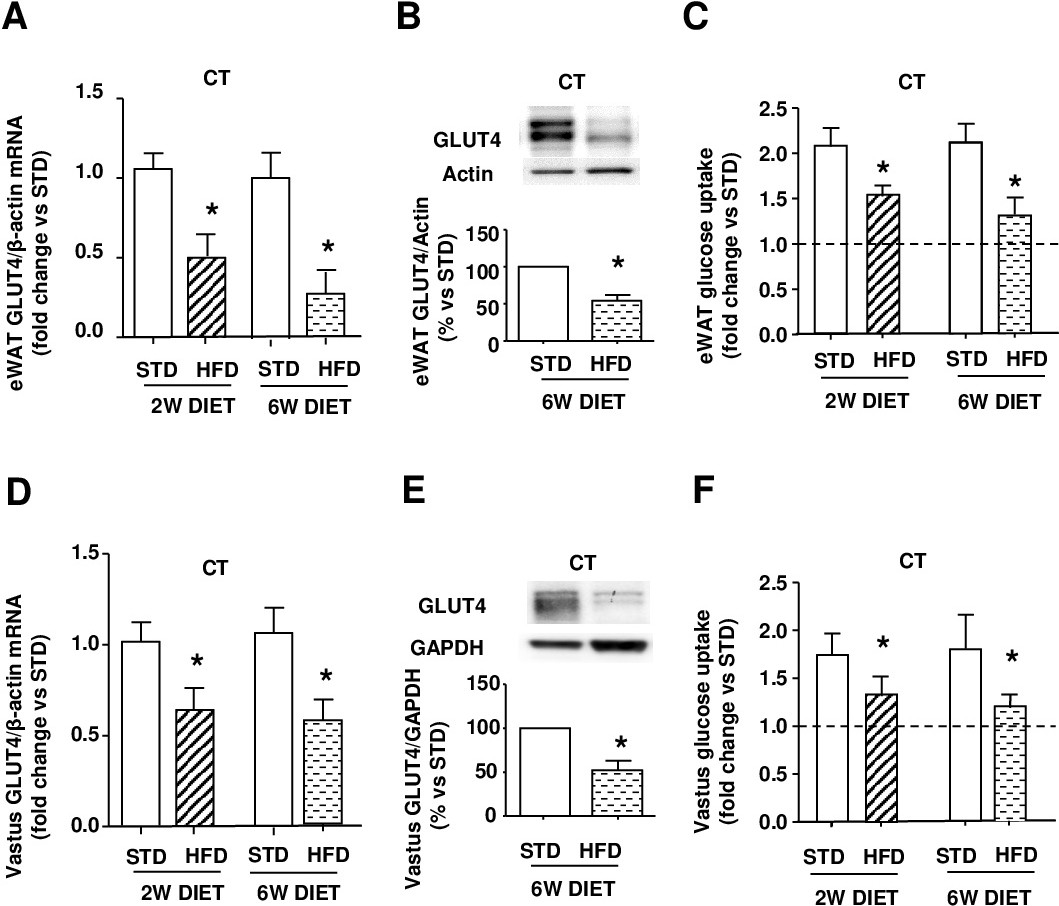
Fig. 4. Glucose transport profile in adipose and skeletal muscle tissues from CT during short-term STD or HFD challenges: GLUT4 expression and insulin-stimulated glucose uptake capacity. Fresh isolated epididymal white adipose tissue (eWAT) and vastus explants were extracted from CT fed with either STD or HFD for 2 or 6 weeks (w). Animals were maintained in fasting conditions before to extract the tissues and proceed to the determinations. GLUT4 mRNA expression levels fold changes, analyzed by RT-qPCR and normalized to β-actin as endogenous control, in eWAT (A) and vastus (D) from CT. Downregulated transcriptional GLUT4 downregulation was demonstrated previously in basal cKD-ILK tissues (Hatem-Vaquero M et al. J Endocrinol. 2017 Aug;234(2):115-128). Representative immunoblots and densitometric analysis of GLUT4 protein levels normalized to Actin or GAPDH as endogenous control from eWAT (B) and vastus (E) of CT fed with either STD or HFD for 6w. Other explants were incubated ex vivo with insulin (100 nM) for 15 min and the fluorescent deoxyglucose analog 2-NBDG (0.1 mM) was added for additional 30 min. The intracellular 2-NBDG fluorescence fold change was determined. Dashed line represents the STD-fed CT basal fluorescence from explants without insulin stimulation. N=12 per group. All data are represented as means ± SEMs. *= P<0.05 vs STD at the same time point.